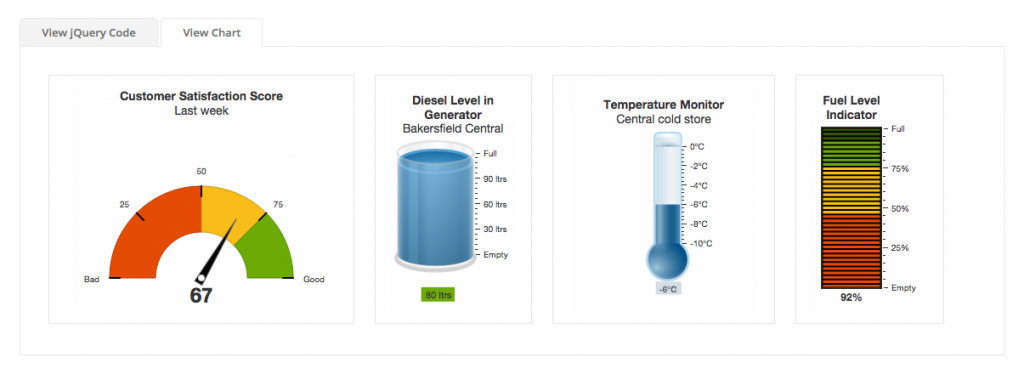
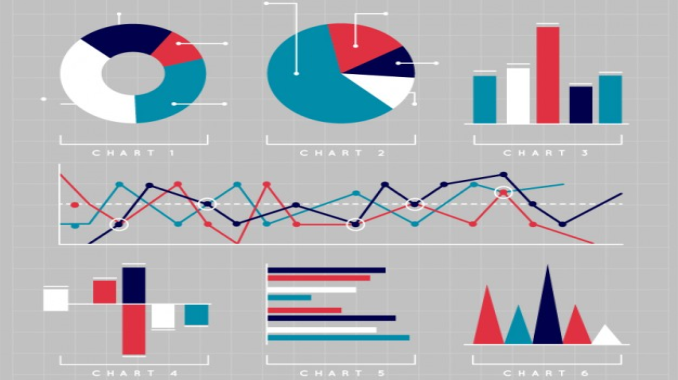
The main advantage of using jQuery charts is transforming the raw, clumsy, dull looking data into an attractive and interactive charts/graphs that develop some kind of interest among the potential readers. Though javascript libraries have hit the market pretty late but with the help of the right tool, one can not only end up creating meaningful charts from the data but even provides an appropriate amount of details while keeping an eye on the big picture.
There is a wide range of jQuery plugin charts available that creates interactive dataviz for a webpage. The following post comprises of top five jQuery charting libraries worth considering.
#1 FusionCharts
Other than the JavaScript charts, FushionCharts offers a jQuery plugin featuring smart design, animation, and a rich interactive experience. The chart works seamlessly across all device types including PC’s, Macs, Android devices, iPads, and iPhones.
It may also interest you to know that charts can be easily rendered from JSON data, XML or HTML tables. Make use of this handy usage guide to get started with the plugin.

#2 Flot
Flot aims to provide elegant, attractive, impressive and easy-to–use charts and graphs. Most of the jQuery developers recommend using the plugin as it offers an interactive range of features that include turning a series on or off, panning and zooming, interacting with data points and automatic re-sizing. In addition to this, other features include support for multiple axes, stacked chart and rendering text with Canvas instead of HTML.
#3 Canvas JS JQuery
CanvasJS JQuery is a kind of charting plugin that comes with CanvasJS. Now while using a plugin, the developer can utilize all the standard features like dynamic updates, panning, zooming events and exporting as images.
The chart, in particular, performs well for large datasets and the basic package includes approx. 24 different responsive chart types.
#4 Peity
There are times when one needs small graphs inline with the content and peity acts as a perfect solution for such situations. The jQuery development plugin enables one to easily convert small data sets into inline bar charts, donut graphs, line graphs or mini pies all in forms of svg which is compatible with any browser, be it Chrome, Opera, Firefox, Safari.
#5 JQuery Sparkliness
The plugin lets you generate small inline charts with data that are either on the direct basis or through embedded JavaScript. The best past of using the plugin is that a developer doesn’t need to write the code himself. A neat code generator is available where one can fill in the data, set the options and have code generated easily. The plugin is meant to provide quick impressions or trends inline with the text.
So this is it for now! Keep watching the space to know more regarding JQuery development projects.


